


BY KEN LUCCI
Based on the most up-to-date industry financial metrics we have observed from performing financial reviews for operator clients and commercial lenders in 2024, as well as a survey of 1,100 operators we have tabulated for our company’s Financial State of the Industry Briefing and Report, all indications are that last year was another good one for the industry in terms of total revenue, gross profit by service, and net profit trends. In addition, a detailed analysis of vertical industries we rely on also performed very well in 2024 and suggest exceptional growth in 2025 and future years. We analyzed data from key sectors including the airline industry, corporate travel, hospitality, and meeting and events (also known as MICE). All these industries posted record revenue growth in 2024 and are forecast for even more upward trajectory in 2025 and beyond. Finally, the US economic outlook is very favorable based on our review of reports concerning 2025 economic forecasts from professional Wall Street and banking analysts. [Editor’s note: You can also read our Benchmark & Best Practices column from the December 2024 for feedback directly from operators.]
Coming out of the pandemic, both 2022 and 2023 were highwater marks for revenue growth and net profitability in our industry. While 2024 was challenging for some, it was an overall great year in terms of total revenue, stable gross profit margins, and net income (profit). The majority of data from large and medium operators was positive and similar to 2023. Being an election year, some found the third and fourth quarters a tad sluggish, but still relatively similar to the same period in 2023.
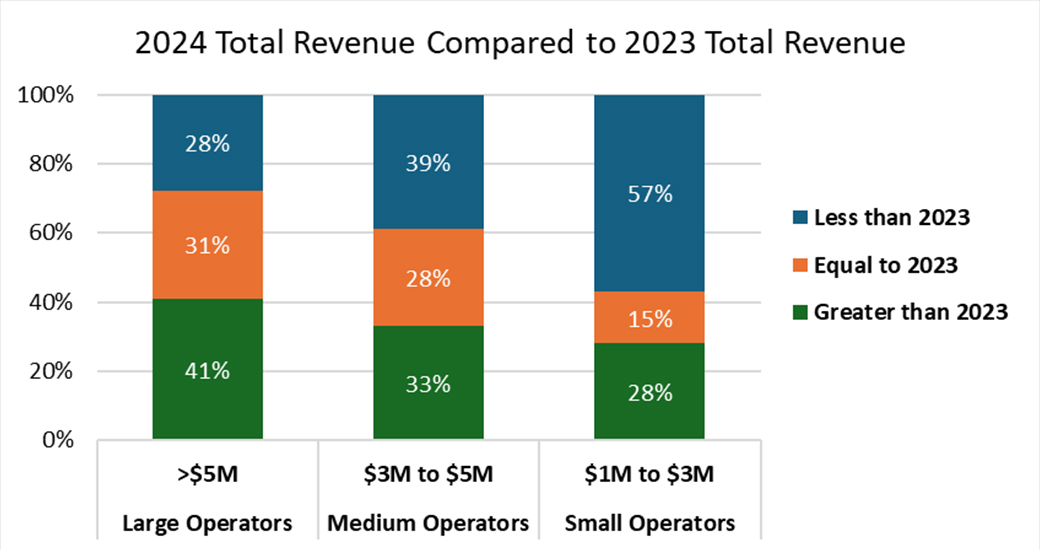 Graph 1 – Revenue Comparison Our internal financial analysis data and our curated survey of 1,100 operators indicate that 72 percent of large operators (those with more than $5M in annual revenue) experienced total revenue at or above 2023 levels. More than 60 percent of medium operators (those with $3M to $5M in annual revenue) posted total revenue at or above 2023 levels also. The smaller operator segment (those averaging $1M to $3M in annual revenue) seemed to struggle a bit in 2024, as only 43 percent reported total revenue at or above 2023. However, when we drilled down on this data point, we found total revenue for 2024 was only slightly below 2023, and it was only between 5 percent and 10 percent for almost all operators. This was usually explained by a loss of a one-time event that took place in 2023 but did not repeat in 2024 or a temporary slowing of some client travel because of election year anxiety.
Performance in Sedan and SUV Revenue:
We observe a pattern both from our clients’ KPI data reviews and the survey results that show operators are concerned about ongoing revenue performance of the sedan and SUV portion of their businesses and specifically, a drop in airport transfers. However, the overwhelming majority also report that any reduction in these segments was more than offset by revenue growth generated from other services, specifically large vehicle categories.
US Economic Outlook Is Strong for 2025:
With the presidential election behind us, most economists (as of press time) are projecting a robust 2025. Based on published articles and analyst reports we have studied from sources such as The Economist, Goldman Sachs, J.P Morgan, Bloomberg, and others, predictions are upbeat for the overall US economy with a few things to watch for. Economists’ forecasts are depending on inflation continuing to decrease, decades low recession fears, tighter immigration policy, lower fuel prices, extended tax cuts, and restrained action by the Trump administration on tariffs.
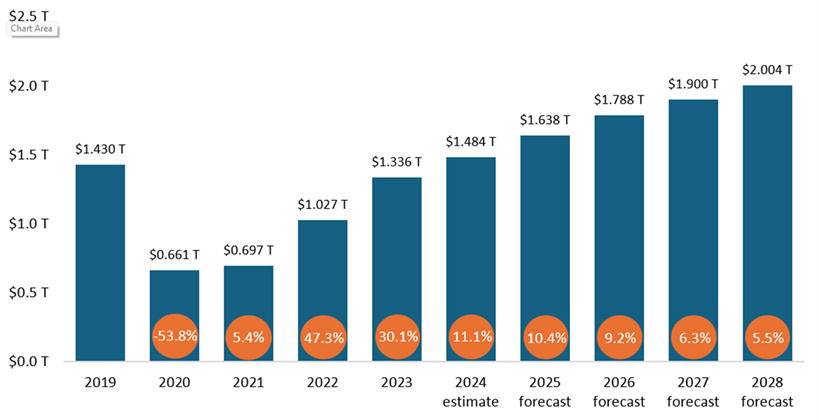 Graph 2 – Boosted by economic stability, pent-up demand and recovery momentum, corporate travel spending is projected to surpass $2 trillion by 2028 according to the latest GBTA Business Travel Index Report. Graph courtesy of GBTA. In addition to rosy overall economic reports, financial forecasts of the industries and corporate stakeholders the chauffeured sector depends on are also overwhelmingly positive. Despite some hiccups in 2024, airlines are forecasting close to 4 percent growth in domestic passengers and 5 percent in international passenger travel. Corporate travel (see graph 2) is also expected to increase 10.4 percent over 2024 record levels. Meanwhile, the US group and meeting sector is expected to grow 4.8 percent year over year while the global MICE (meetings, incentives, conferences, and exhibitions) is growing at 9.1 percent annually, which is close to double the US meeting rate.
Key Initiatives of the New Administration That Are Expected to Affect the Economy:
❱ Tariff increases on imports from China (and other countries) and on autos may raise prices by 3 to 4 percentage points. Economists are concerned this could have a temporary negative effect on some sectors.
❱ Tighter immigration policy may lower net immigration to 750,000 per year, below the 2019 average of 1 million per year. Certain business sectors could be negatively affected by this, such as agriculture, food production, and even hospitality.
❱ 2017 tax cuts are expected to be extended instead of expiring, and most economists anticipate modest additional tax cuts. This is a watch list item for the first 100 days of the new administration. This more than any other policy is expected to have a positive impact, and most economists are hoping this will happen by late spring in 2025.
While overall forecasts are bright for 2025, we always suggest projecting several budget outcomes that consider the good and the potentially bad. For example, we advise operators create a budget that forecasts a sudden decrease in revenue, whether the loss of a large client or something totally out of your control so you can be prepared for the negative revenue and cash effect on the business. They say past is prologue, so it is wise to anticipate a worst-case scenario for your business and hope it never occurs.
Worried that our outlook is a tad too rosy? Here are our top 12 financial recommendations for 2025:
1. Create a monthly budget using 2024 as a base and forecast the effects of up or down change.
2. Increase cash on-hand, preferably setting aside at least four months of all base expenses.
3. Shed poor-performing vehicle assets by Q2 and bank the cash.
4. Resist the urge to add to debt above a total of 0.3 (30 percent) of expected annual revenue.
5. Pay down lines of credit, EIDL, and any debt that is not associated with fleet assets.
6. Focus on profitable revenue growth (revenue with 35 to 45 percent gross profit).
7. Manage direct cost of goods like overtime labor (brace for fleet insurance increases).
8. Review pricing quarterly and increase prices on larger vehicles where possible.
9. Strive for gross profit margins of 35 to 45 percent on all services (40 percent blended).
10. Control G&A spending and track ordering and logistics costs per transaction.
11. Have a net ordinary income (net profit from the operation) with a target greater than 10 percent.
12. Have a standard EBITDA with a target greater than 15 percent.
We have a slew of information, including a 5-year industry outlook, on our website at drivingtransactions.com or get a PDF of the Financial State of the Industry Briefing with actionable business strategy recommendations by emailing us at research@drivingtransactions.com. [CD0225]
Ken Lucci is the principal business analyst and founder of DrivingTransactions.com. He can be reached at klucci@drivingyourincome.com.